Turning Data to Doing in Indiana
Quantitative finance is an exciting hobby that’s made even more exciting by leveraging data from disparate sources to improve performance, right? David Muegge, a resident Hoosier and data doer certainly believes so. In the second installment of Bringing Data to Doing in Indiana, we sat down with David to explore how he uses data outside of his day job to improve outcomes.

What is your background?
My background is heavily infrastructure and IT architecture based. I have over 25 years of experience in various systems engineering and architecture roles. My experience in information technology is most recently in areas of storage, virtualization and data protection. While not working with Splunk customers, I enjoy spending time with my wife and Labrador retrievers. I also like cruising twisty mountain roads on my motorcycle.
How do you leverage data in your personal interests?
Over the past 24 months or so, I have been studying investing and stock trading while also working to become more proficient with Splunk. I like to combine activities and gain momentum, so I decided stock market and economic data would be the perfect way to improve my Splunk chops and maybe even my investing/trading. I always learn better when I am interested in the topic! When I started to dig in further, I found way more similarities between my day job and quantitative finance – the primary ones being lots of data, Python and machine learning.
When starting to do trading research, I found there were various places to get market and economic data. Places like the Federal Reserve (FRED), the exchanges, the census, the bureau of economic analysis, etc. In the end I found I could get most of the core data I wanted from three places:
- Federal Reserve Economic Data: FRED is an economic data repository hosted and managed by the Federal Reserve Bank of St. Louis.
- Quandl: This is a data service that is now owned by NASDAQ and features many free and pay sources for market and economic data. There are various sources like this, but this I chose to start here as it fit my need and budget.
- Gurufocus: This is a site with pay and free resources but offers some great fundamental data available via REST API to subscribers.
The sources are endless and only limited by your imagination, and your wallet, as some data is very expensive. The main data most people will start with is end of day stock quote data and fundamental financial data. Splunk also provides an extensible app development platform, which can be used to build add-ons for data input. I will likely move my data load processes to this model in the future.
You mentioned machine learning. Machine Learning can be somewhat intimidating or difficult to wrap our minds around if we do not have a data science background. Is that in your background or how are you leveraging machine learning if it was not?
So true. I would consider myself a citizen data scientist. Machine Learning is not a part of my background so I have taught myself and learned “on the job” so to speak. I still have a lot to learn, but the Splunk platform has the ability to integrate custom code via the Machine Learning Toolkit (MLTK) as custom algorithms. It was not too difficult to make progress and implement analysis, such as concepts from modern portfolio theory for risk optimization and return projection. Additionally, this gives me a path to do more advanced things using the MLTK without having a deep background or training in machine learning. I have only scratched the surface on this subject and I have lots of ideas to explore and learn in the future. Splunk simplifies operationalizing these processes and, in my opinion, makes the task of getting from raw data to usable information much easier.
As a Doer, can you give us an example of applying data in the quantitative finance world?
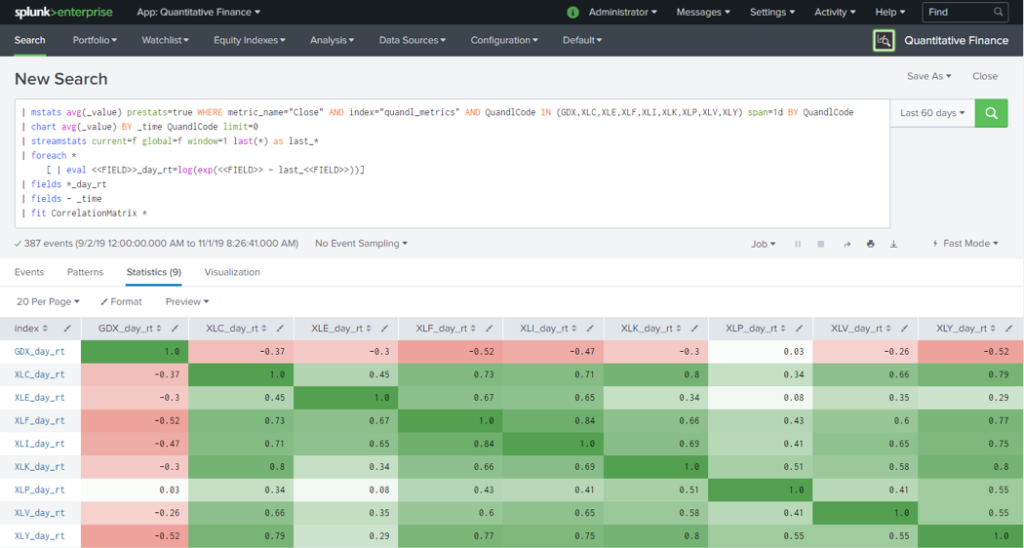
The example below shows the correlation of all of the examined Exchange Traded Funds over a period of 60 days. The value of 1 is perfectly correlated and the value of -1 is perfectly inversely correlated. Correlation of assets is one of the base calculations required in modern portfolio theory to determine theoretical portfolio risk and return.
As an engineer for your day job, what is an example of how you’ve helped a customer with insight based on the work you do with quantitative finance on the side?
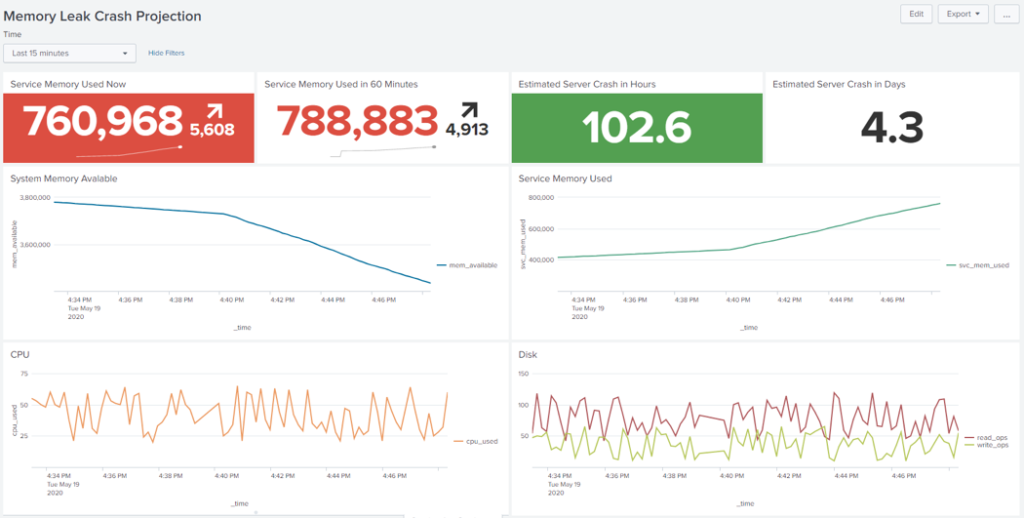
One thing I realized after experimenting with financial data is I could not have picked a harder problem to try and learn more about machine learning. I ran across a customer wanting to predict a server crash due to a memory leak. This is typically a very predictable and easy to solve problem. The work I did with the financial data and MLTK translated well and it was pretty simple to build the memory leak model. Here is the end result dashboard.
How do you stay motivated to continue learning?
I learn way better and faster by doing. Especially when I am interested in the topic, it helps to dive in and self-teach. With data and applying it to everything, there really is no end to what can be done. Leveraging flexible and extensible technology gets me to the end outcomes more rapidly. As for quantitative finance, that world is ever changing and impacted by so many variables, I need to leverage data to keep up and make the most informed decisions.
How are you putting data to work for good within your organization, community, or life? #INDataDoers #DataToEverything


